What are golden and dead forks
Introduction
Technical analysis applies a wealth of chart patterns, and before we introduce the two patterns, we first need to understand what a moving average (MA) is. Simply put, it is a line plotted on a price chart that measures the average price of an asset over a given time period. For example, a 200-day moving average measures the average price of an asset over the last 200 days. So what exactly are golden and dead forks and how can traders use them in their trading strategies?
What is a golden cross?
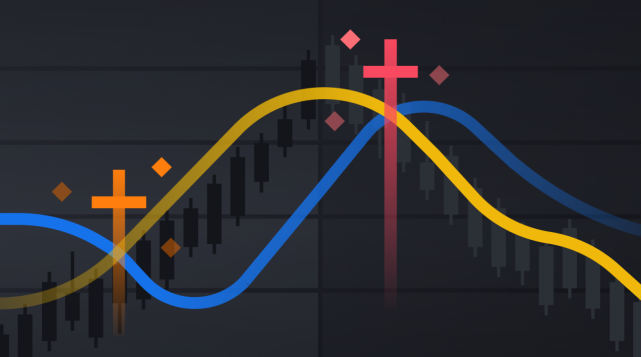
A golden cross (or golden cross) is a chart pattern that generally refers to a short-term moving average crossing upwards through a long-term moving average. We generally use the 50-day MA as the short-term average and the 200-day MA as the long-term average. However, this is not the only way a golden cross can present itself. It can occur in any time frame, with the basic scenario being a short-term average crossing up through a long-term average.
A golden cross generally appears in three stages:
1. In a downtrend, the short-term average lies below the long-term average.
2. The trend reverses and the short-term average crosses the long-term average.
3. The short-term average stays above the long-term average and an uptrend begins.

In many cases, a golden cross may be seen as a bullish signal. Why? The reasoning is simple. As we know, moving averages measure the average price of an asset over the period of time it is charted. From this perspective, a short-term average below the long-term average means that short-term prices are trending bearish compared to long-term price action.
Now, what happens when the short-term average crosses the long-term average? The answer is that the short-term average price will be higher than the long-term average price. This indicates a potential change in the market trend, and the golden cross has thus become a recognized bullish signal.
In the conventional concept, a golden cross is a crossing of the 50-day average above the 200-day average. However, the general idea behind a golden cross is that the short-term moving average crosses the long-term moving average. Therefore, golden crosses can occur in other time frames (15-minute, 1-hour, 4-hour, etc.) as well. Nonetheless, signals within long time frames tend to be more reliable than short time frames.
So far, we have introduced golden crosses of simple moving averages (SMAs). However, there is another common method of calculating moving averages called the Exponential Moving Average (EMA). It uses a completely different formula that emphasizes recent price behavior.
The EMA can also be used to find crossovers of bullish and bearish trends, including golden crosses. This tool is able to react more quickly to recent price action, but the crossovers they produce can be less reliable and subject to more false signals. Even so, EMA crosses are commonly used as a tool to identify trend reversals.
What is a dead cross?
A dead cross is basically the opposite of a golden cross. In this chart pattern, the short-term average is below the long-term average. For example, the 50-day average is below the 200-day average. Therefore, a dead cross is a recognized bearish signal.
Dead crosses also generally occur in three stages:
1. In an uptrend, the short-term average is above the long-term average.
2. The trend reverses and the short-term average falls below the long-term average.
3. A downtrend occurs when the short-term average remains below the long-term average.

After understanding the Golden Cross, it is naturally easy to understand why the Dead Cross is a bearish signal. Short-term averages fall below long-term averages, signaling a bearish outlook for the market.
Throughout history, the dead cross has given bearish warnings before many financial crises (e.g. 1929 or 2008). However, it can also release false signals, with 2016 being a classic misjudgment.

As you can see in the example, the market signaled a dead cross, but quickly resumed its uptrend and eventually formed a golden cross.
What is the difference between a Golden Cross and a Dead Cross?
After discussing the concepts of golden and dead forks, the difference between the two is easy to understand. They are essentially opposite opposites of each other. A golden cross may be seen as a bullish signal, while a dead cross is seen as a bearish signal.
Both can be confirmed by high volume. When analyzing crossover lines, some technical analysts also refer to other technical indicators. Common examples include the exponentially smoothed moving average (MACD) and the relative strength index (RSI).
It is important to note that moving averages are lagging indicators and do not have predictive capabilities. Two crossovers will usually clarify a trend reversal that has already taken place, but it is impossible to analyze a reversal trend that is still in progress.
How to Trade Based on Golden and Dead Cross Patterns
The basic idea behind these patterns is very simple. If one understands how traders utilize the MACD, it is easy to understand how to trade based on these crossover signals.
When talking about golden and dead crosses, we usually look at the daily trading charts. Therefore, the simplest strategy is to buy when a golden cross occurs and sell promptly after a dead cross occurs. This has been a relatively successful bitcoin trading strategy over the past few years, despite many false signals. Therefore, blindly following a signal is usually not the best strategy. When it comes to market analysis techniques, traders need to take into account numerous factors.
The crossover strategy mentioned above is based on daily average crossovers. What about other time frames? Golden crosses and dead crosses occur in the same circumstances, and traders can take full advantage of both indicators.
However, as with most chart analysis techniques, signals are usually more accurate over long timeframes than short timeframes. When you see a dead cross in a timeframe of hourly intervals, you may see a golden cross if you stretch the span to a week. Therefore, it is effective to zoom in on the time period and look at the trend of the chart (taking into account a number of parameters).
When trading based on golden and dead crosses, many traders also pay attention to volume. As with other chart patterns, volume is an important tool for trend confirmation. When volume spikes accompany a crossover signal, many traders are more certain that the signal is valid.
When a golden cross occurs, the long-term moving average may be seen as a potential support area. Conversely, a dead cross signal may be viewed as a potential area of resistance.
Cross signals can also be cross-checked with other technical indicators to find convergence points. Fusion traders combine multiple signals and indicators into a single trading strategy to make trading signals more reliable.
➟ Want to start your digital currency journey? Go to Bingat to buy Bitcoin now!

Summarizing
In this article, we discussed the most commonly used crossover signals: golden crosses and dead crosses.
A golden cross is when a short-term moving average crosses the long-term moving average upwards. A dead cross is when the long-term moving average falls below the short-term moving average. Both indicators are reliable tools for confirming a long-term trend reversal, whether in the stock market, forex or cryptocurrency market.


Comments
Post a Comment